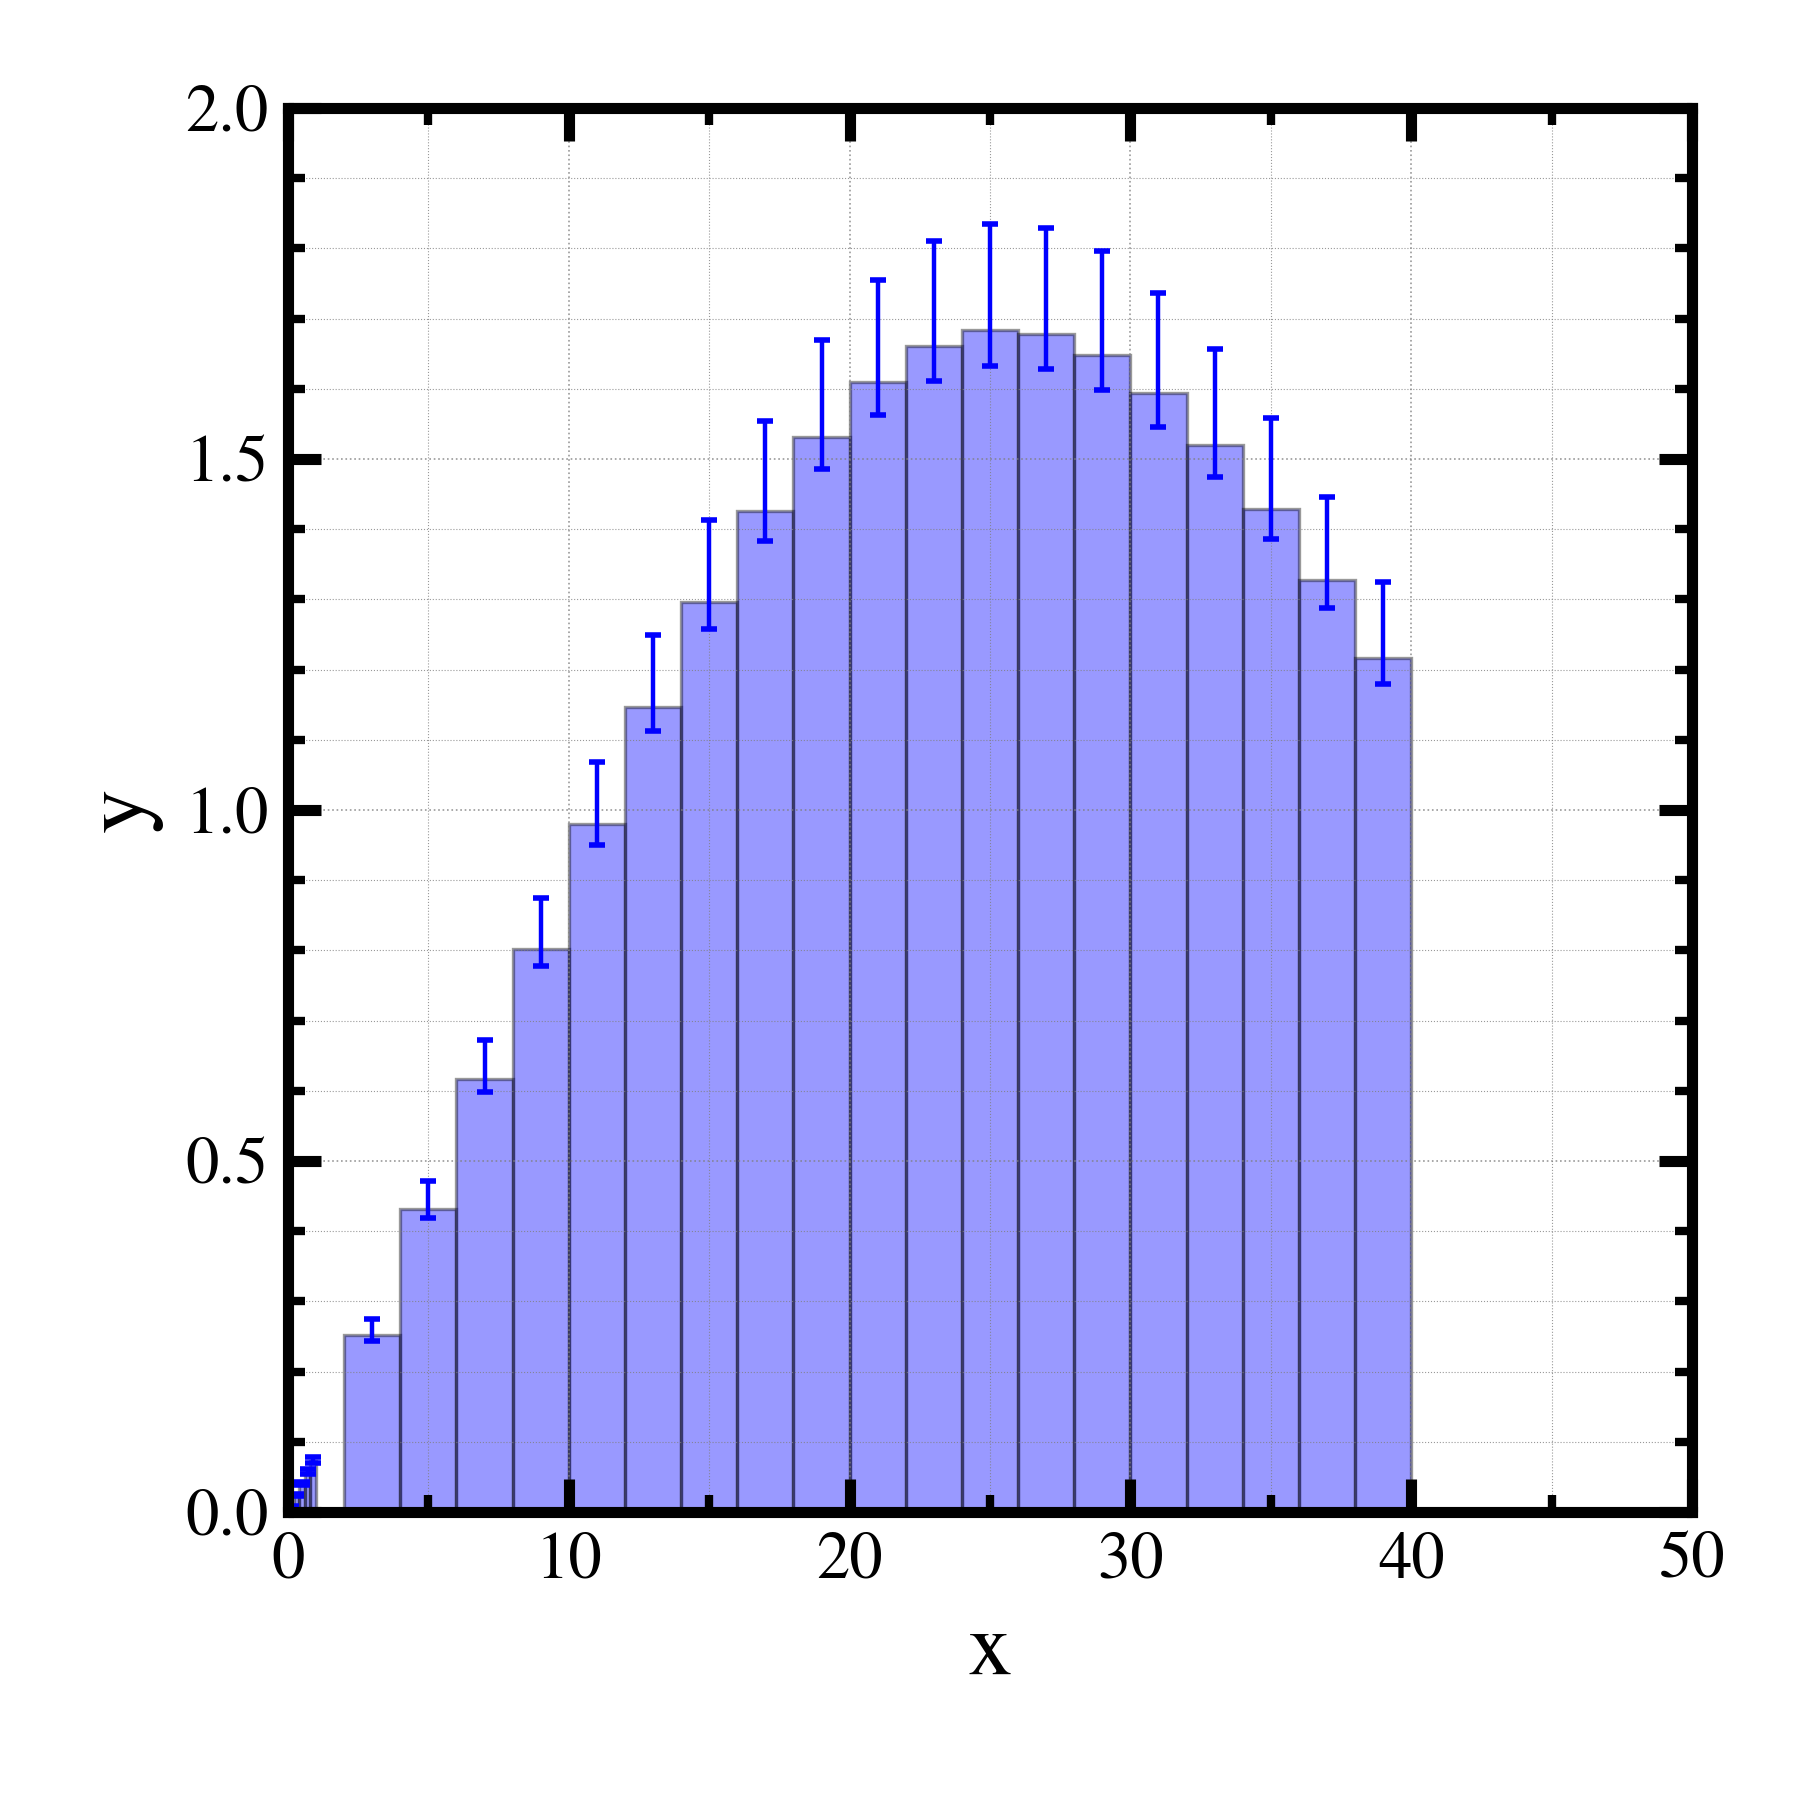
gplot1D.py (1) ヒストグラム (バー)
gplot1D.py にて、add__bar() 中で、 xMin, xMaxで、横方向のレンジを記載 すればよい.
PHITS等のエネルギースペクトラムの表示に使用可能.
errorbar の指定は、
(nData,)の配列 (上下等間隔)、または、
(2,nData)の配列 (上下のエラー範囲)
グラフ
コード
import os, sys
import numpy as np
import nkUtilities.load__config   as lcf
import nkUtilities.gplot1D        as gp1

# ========================================================= #
# ===  draw__histogram                                  === #
# ========================================================= #


def draw__histogram():

    # ------------------------------------------------- #
    # --- [1] generate sample data                  --- #
    # ------------------------------------------------- #
    xAxis1 = np.linspace( 0,  1,  6 )
    xAxis2 = np.linspace( 2, 40, 20 )
    xMins  = np.concatenate( [ xAxis1[:-1] , xAxis2[:-1] ] )
    xMaxs  = np.concatenate( [ xAxis1[ 1:] , xAxis2[ 1:] ] )
    xAxis  = 0.5 * ( xMins + xMaxs )
    yAxis  = (xAxis)/np.sqrt( 2.0*np.pi*20.0 ) * np.exp( -0.5*( ( (xAxis-10.0)/20.0 )**2 ) )
    yerr1  = 3.0 / 100 * yAxis
    yerr2  = np.concatenate( [ yerr1[np.newaxis,:], 3.0*yerr1[np.newaxis,:] ], axis=0 )

    # ------------------------------------------------- #
    # --- [2] plot                                  --- #
    # ------------------------------------------------- #
    config   = lcf.load__config()
    config_  = {
        "figure.size"        : [4.5,4.5],
        "figure.pngFile"     : "png/gplot1d__p1_01.png",
        "figure.position"    : [ 0.16, 0.16, 0.94, 0.94 ],
        "ax1.y.normalize"    : 1.0e0,
        "ax1.x.range"        : { "auto":False, "min": 0.0, "max":50.0, "num": 6 },
        "ax1.y.range"        : { "auto":False, "min": 0.0, "max": 2.0, "num": 5 },
        "ax1.x.label"        : "x",
        "ax1.y.label"        : "y",
        "ax1.x.minor.nticks" : 2,
        "ax1.y.minor.nticks" : 5,
        "plot.markersize"    : 3.0,
        "legend.fontsize"    : 9.0,
    }
    config = { **config, **config_ }
    fig    = gp1.gplot1D( config=config )
    fig.add__bar( xMin=xMins, xMax=xMaxs, yAxis=yAxis )
    # fig.add__errorbar( xAxis=xAxis, yAxis=yAxis, yerr=yerr1 )
    fig.add__errorbar( xAxis=xAxis, yAxis=yAxis, yerr=yerr2 )
    fig.set__axis()
    fig.save__figure()


# ========================================================= #
# ===   Execution of Pragram                            === #
# ========================================================= #

if ( __name__=="__main__" ):
    draw__histogram()